DVQA: Understanding Data Visualization through Question Answering Try live demo!
A synthetic question-answering dataset on images of bar-charts

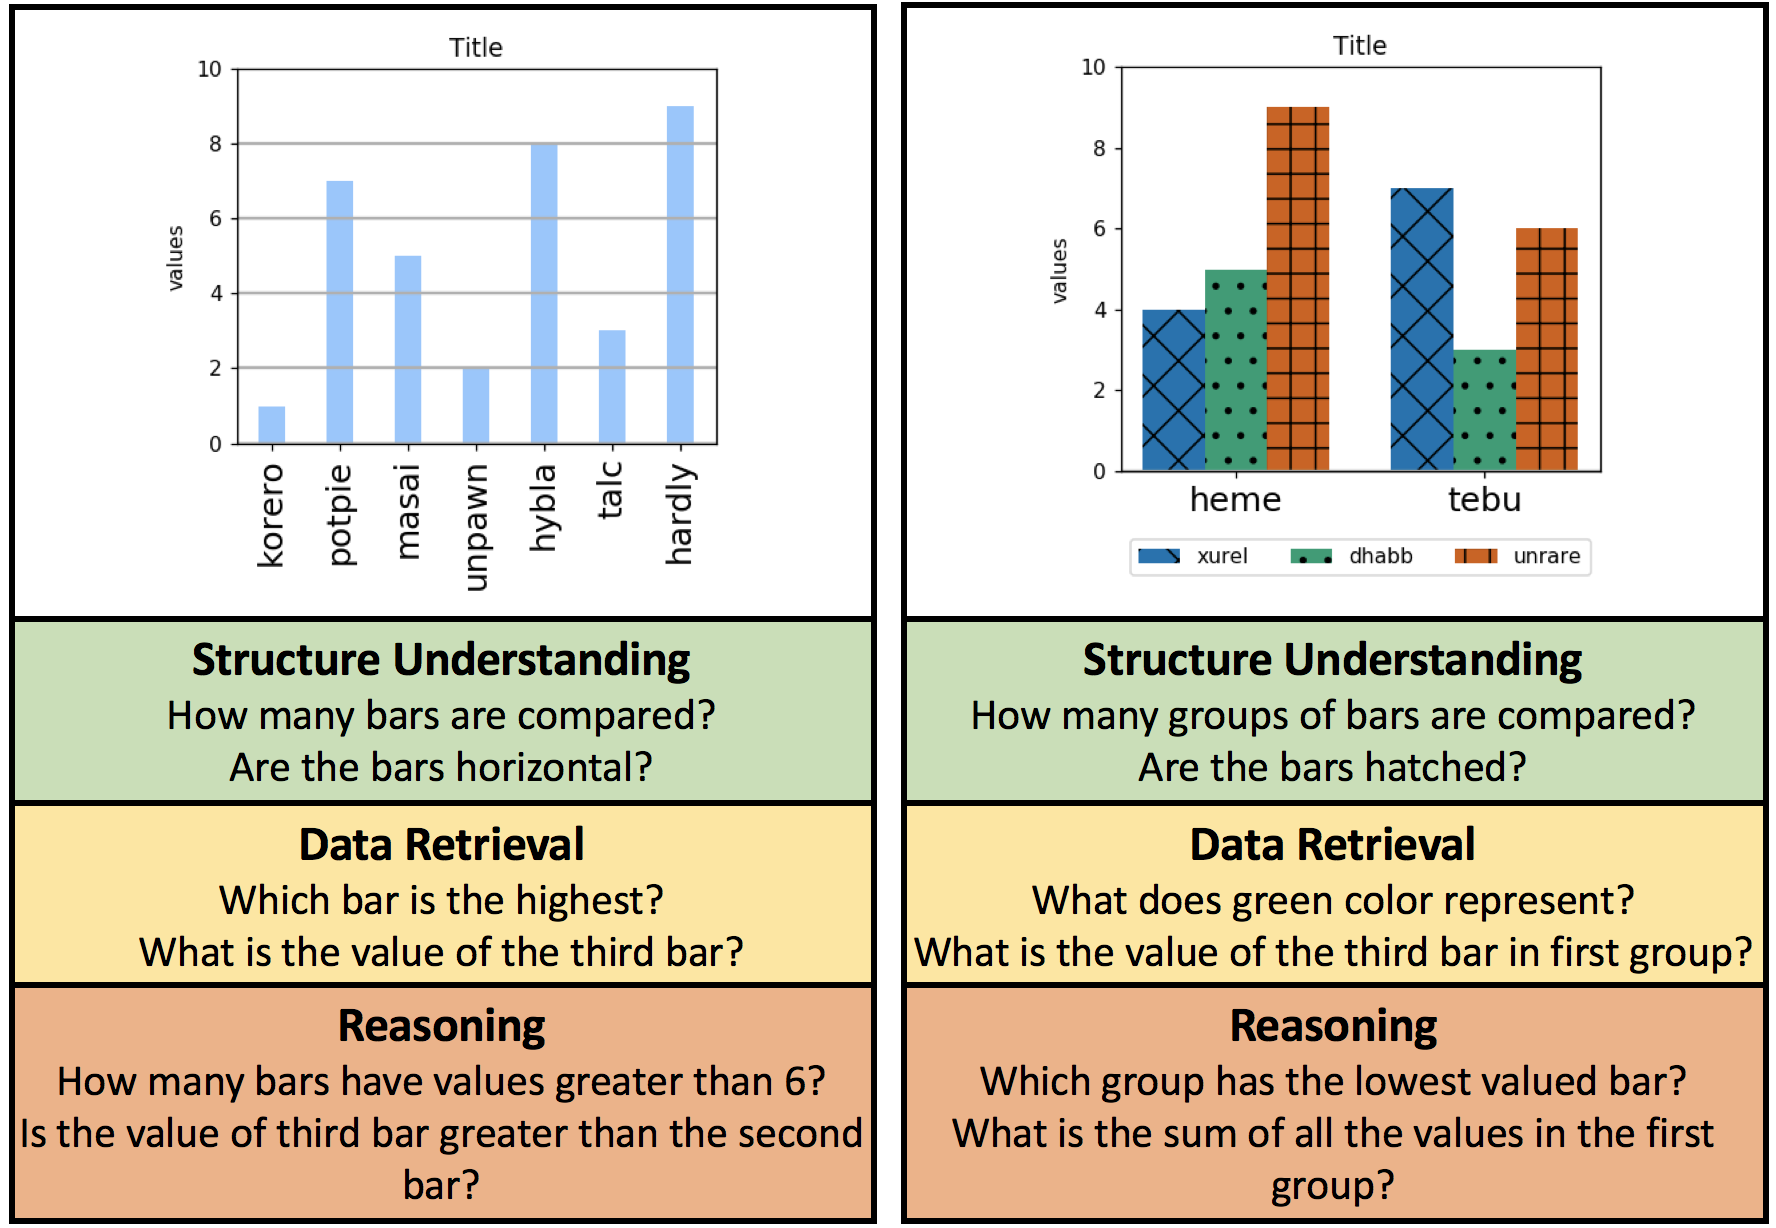
Data visualizations, e.g., bar charts, pie charts, and plots, contain large amounts of information in a concise format. These visualizations are specifically designed to communicate data to people, and are not designed to be machine interpretable. Nevertheless, making algorithms capable to make inferences from data visualizations has enormous practical applications. Here, we study systems capable of answering open-ended questions about bar charts, which we refer to as data visualization question answering (DVQA). DVQA would enable vast repositories of charts within scientific documents, web-pages, and business reports to be queried automatically.
Unlike visual question answering (VQA), DVQA requires processing words and answers that are unique to a particular bar chart. State-of-the-art VQA algorithms perform poorly on DVQA, and we propose two strong baselines that perform considerably better. Besides practical benefits, DVQA also serves as an important proxy task for several critical AI abilities, such as attention, working memory, visual reasoning and an ability to handle dynamic and out-of-vocabulary(OOV) labels.


